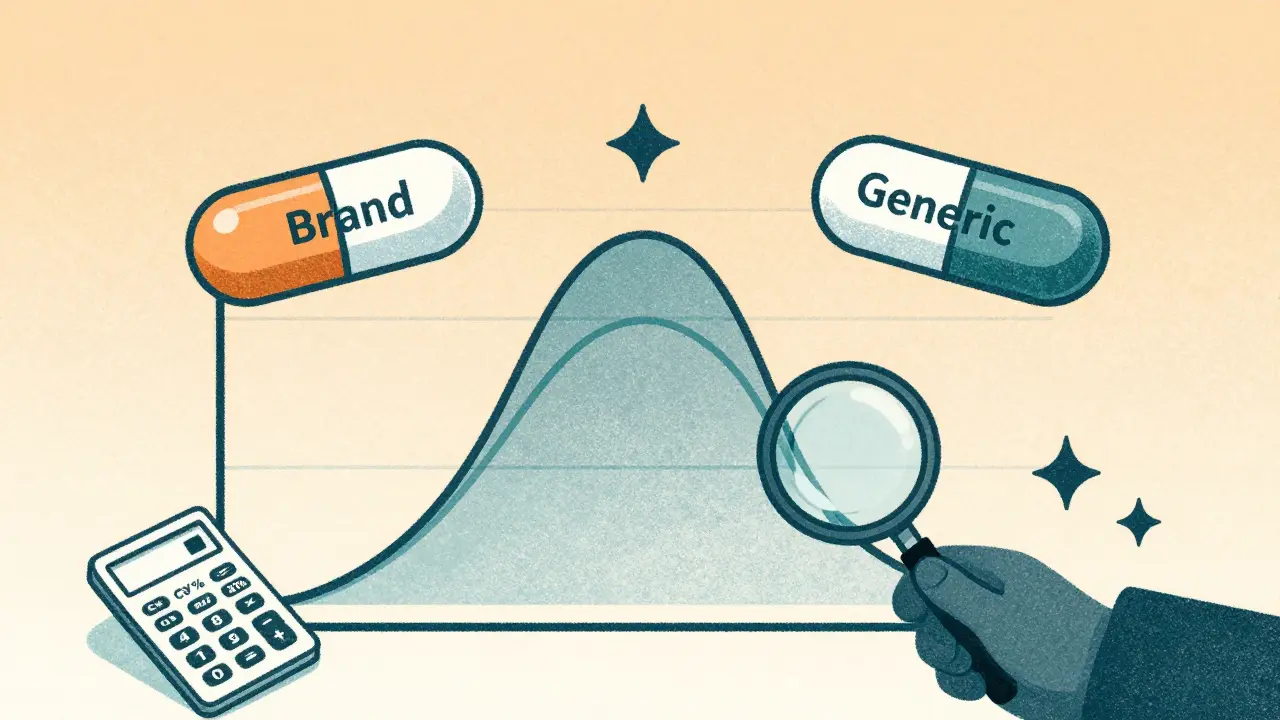
When a generic drug company wants to get its product approved, it doesn’t need to run a full clinical trial like the original brand did. Instead, it runs a bioequivalence (BE) study-a focused, tightly controlled trial that proves the generic version behaves the same way in the body as the brand-name drug. But here’s the catch: if the statistical analysis is wrong, the whole study fails. And one of the biggest reasons studies fail? Poor planning of power and sample size.
Why Power and Sample Size Matter in BE Studies
Imagine you’re testing two painkillers. One is the brand-name version. The other is the generic. You give them to 10 people and measure how fast each drug gets into the bloodstream. The numbers look close. But is that because they’re truly the same, or just because you didn’t test enough people? That’s the core problem in BE studies.
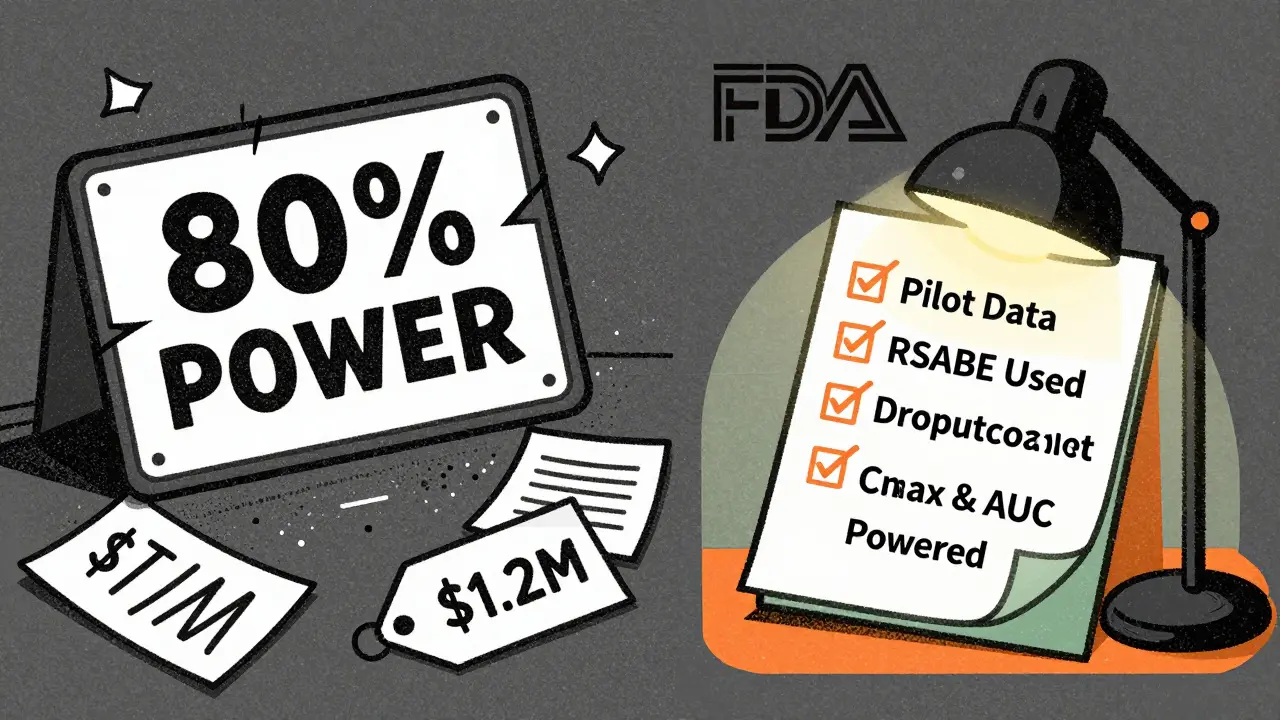
Statistical power is the chance that your study will correctly show the two drugs are equivalent-if they really are. Most regulators, like the FDA and EMA, require at least 80% power. That means if the drugs are truly equivalent, your study has an 80% shot at proving it. Many sponsors aim for 90% to be safe. But power isn’t magic. It depends entirely on three things: how variable the drug is in people, how close the two products are in how they’re absorbed, and how many people you test.
Sample size is just the number of volunteers you need to meet that power goal. Too few? You risk missing a real difference. Too many? You waste money, time, and expose more people than needed to testing. Both are costly mistakes.
How Variability Drives Sample Size
Not all drugs are created equal when it comes to how much they vary between people. Some drugs are absorbed almost the same way in everyone. Others? One person might absorb 50% more than another. This variation is measured as the within-subject coefficient of variation (CV%).
For a low-variability drug (CV% under 10%), you might only need 12-18 people. For example, a simple salt tablet like metformin has very stable absorption. But for a highly variable drug like warfarin or cyclosporine, CV% can hit 35-50%. In those cases, without special methods, you might need 80-100+ subjects just to have a decent chance of proving equivalence.
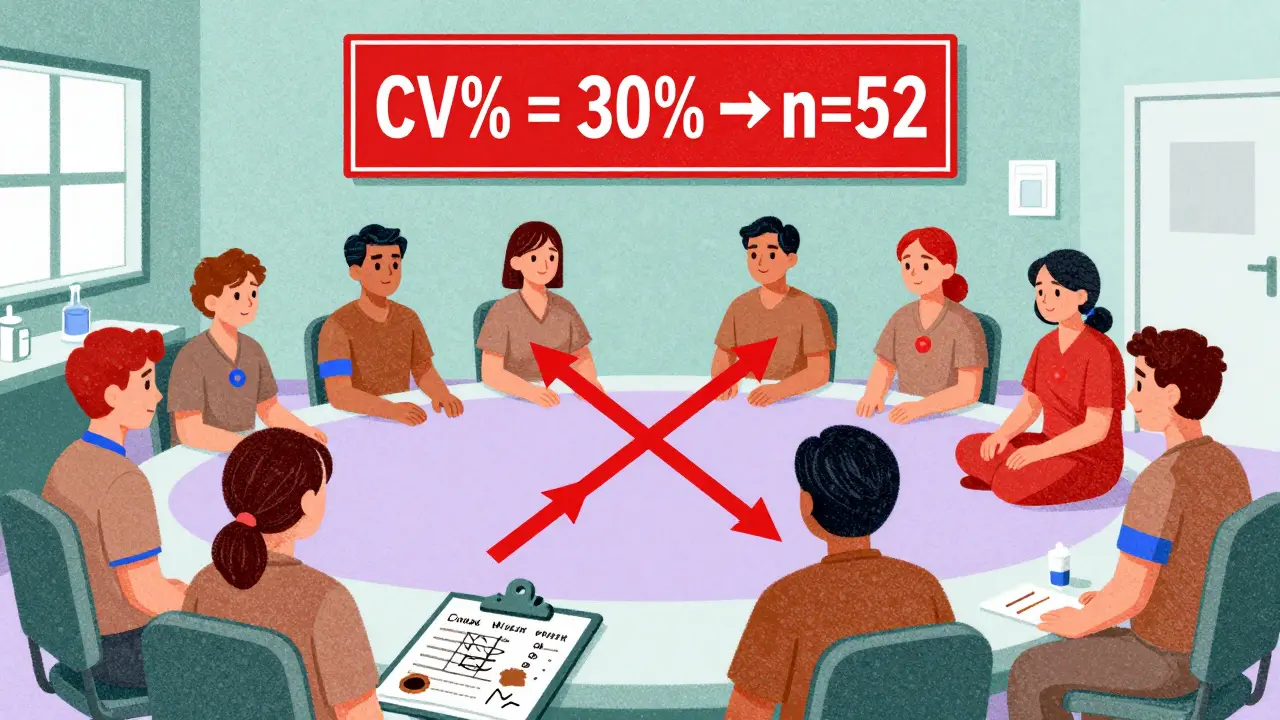
Here’s a real-world example: A BE study for a drug with a 20% CV and an expected geometric mean ratio (GMR) of 0.95 (meaning the generic delivers 95% of the brand’s exposure) needs about 26 subjects to hit 80% power. But if the CV jumps to 30%, the same study now needs 52 subjects. Double the variability, double the sample size. That’s why pilot studies matter so much.
The Equivalence Range and How It’s Used
BE doesn’t mean “identical.” It means “close enough.” Regulators define this as an 80-125% range for the geometric mean ratio of test to reference. If the average exposure of the generic is between 80% and 125% of the brand, it’s considered bioequivalent.
This range is fixed for most drugs. But for highly variable drugs (CV > 30%), regulators allow a trick called reference-scaled average bioequivalence (RSABE). Instead of using a fixed 80-125% range, the limits widen based on how variable the reference drug is. This is a game-changer. A drug with a 45% CV might need 120 subjects under standard rules. With RSABE, that drops to 24-48. The FDA allows this. The EMA allows it too, but with different rules. Getting this wrong can sink a submission.
What Happens When You Get It Wrong
The FDA’s 2021 report showed that 22% of Complete Response Letters (the official “your application is rejected” notices) cited inadequate sample size or power calculations. That’s not rare. It’s common.
One company assumed their drug had a 15% CV based on old literature. But when they ran the real study, the actual CV was 28%. Their sample size of 30 was now too small. The study failed. They had to restart. Cost? Over $1.2 million. Time? 14 months.
Another common mistake? Assuming the test and reference drugs have exactly the same absorption (GMR = 1.00). In reality, even well-made generics rarely hit exactly 100%. If you assume 1.00 but the true ratio is 0.95, your sample size calculation underestimates the needed number by 32%. That’s a huge gap.
Design Matters: Crossover vs. Parallel
Most BE studies use a crossover design: each volunteer gets both the test and reference drug, separated by a washout period. This cuts variability because each person is their own control. It’s efficient. But it requires careful handling of sequence effects-like whether taking the brand first affects how the body responds to the generic later.
Parallel designs (different groups get different drugs) are rarely used because they need 4-5 times more subjects. They’re only chosen when the drug can’t be given twice-like with very long half-life drugs or those with serious side effects.
EMA rejected 29% of BE studies in 2022 for not properly accounting for sequence effects in crossover designs. That’s a technical error, but it’s deadly. You can’t just assume the order doesn’t matter. You have to test for it.
Software and Tools You Actually Need
You don’t need to memorize formulas. But you do need reliable software. Tools like PASS, nQuery, and FARTSSIE are built for BE studies. They handle log-normal distributions, crossover designs, and regulatory limits automatically.
For example, FARTSSIE is free and widely used in industry. You plug in: expected CV%, expected GMR, target power (80% or 90%), and the equivalence limits. It spits out the sample size. Most statisticians tweak these numbers iteratively. What if the CV is 25% instead of 20%? What if the GMR is 0.92? They run 5-10 versions before locking in.
And always, always account for dropouts. If you expect 10% of volunteers to leave, add 10-15% extra to your sample size. If you plan for 30 and 4 drop out, you’re down to 26. That might be below your power threshold.
What Regulators Actually Look For
The FDA’s 2022 Bioequivalence Review Template spells it out: your sample size justification must include:
- The software used and its version
- All input parameters (CV%, GMR, power, equivalence limits)
- Source of CV% (pilot data? literature?)
- How dropouts were handled
- Whether RSABE was used and why
18% of statistical deficiencies in 2021 submissions were due to incomplete documentation. That’s not a statistical error. It’s a paperwork error. And it’s just as fatal.
What Experts Say
Dr. Donald Schuirmann, a top BE methodologist, calls underpowered studies “one of the most common statistical failures in generic drug development.” He’s seen it too many times.
Dr. Laszlo Endrenyi says 37% of BE study failures in oncology generics between 2015 and 2020 were caused by using optimistic CV estimates from literature instead of real pilot data. Literature CVs are often 5-8% too low. That’s not a small error. It’s a recipe for failure.
And here’s something most sponsors miss: you need power for both Cmax and AUC. Not just the more variable one. If you only power for AUC and Cmax turns out to be the outlier, you’ve failed. A 2022 survey found only 45% of sponsors do this right.
What’s Changing
Regulators are pushing for more transparency. The 2023 draft FDA guidance now requires sample size re-estimation in adaptive designs-meaning you can adjust your sample size mid-study if early data shows you’re underpowered. This isn’t common yet, but it’s coming.
Model-informed bioequivalence (MIBE) is the next frontier. Instead of just using Cmax and AUC, you use complex pharmacokinetic models to predict exposure. This could cut sample sizes by 30-50%. But right now, only 5% of submissions use it. Regulatory uncertainty holds it back.
But here’s the bottom line: no matter how fancy the math gets, the core hasn’t changed. You still need to know your variability. You still need to justify your numbers. And you still need enough people to be sure.
Practical Checklist for BE Study Planning
- Start with pilot data-not literature-for CV%. Literature underestimates variability by 5-8%.
- Assume a realistic GMR (0.95-1.05). Never assume 1.00.
- Use 90% power if you’re targeting global approval (FDA often expects it).
- Always calculate power for both Cmax and AUC.
- If CV% > 30%, explore RSABE. It could cut your sample size in half.
- Add 10-15% to your sample size to cover dropouts.
- Document everything: software, inputs, assumptions, and sources.
- Run sensitivity analyses: What if CV% is 5% higher? What if GMR is 0.92?
What is the minimum sample size for a bioequivalence study?
There’s no universal minimum, but studies with low-variability drugs (CV% < 10%) can sometimes use as few as 12-18 subjects. However, most studies aim for 24-36 subjects to ensure adequate power. For highly variable drugs (CV% > 30%), sample sizes can exceed 80 without using RSABE. Always base your number on proper power analysis, not rules of thumb.
Why is 80% power the standard in BE studies?
80% power means there’s an 80% chance your study will correctly detect bioequivalence if the two products are truly equivalent. It’s a balance between cost and reliability. Higher power (like 90%) is often preferred by the FDA, especially for narrow therapeutic index drugs, but 80% is the regulatory minimum accepted by both FDA and EMA. Going below 80% is rarely allowed.
Can I use literature values for CV% in my sample size calculation?
You can, but it’s risky. FDA reviews show that literature-derived CV% values underestimate true variability in 63% of cases by 5-8 percentage points. This leads to underpowered studies. The safest approach is to use pilot data from your own formulation. If you must use literature, add a safety margin-assume the CV is 10-15% higher than reported.
What’s the difference between RSABE and standard BE?
Standard BE uses fixed equivalence limits (80-125%) regardless of variability. RSABE adjusts those limits based on how variable the reference drug is. For example, if the reference drug has a CV% of 40%, the limits might widen to 70-143%. This allows smaller sample sizes for highly variable drugs. RSABE is approved by both FDA and EMA but requires specific statistical methods and justification.
Do I need to power for both Cmax and AUC?
Yes. Regulatory agencies require bioequivalence to be demonstrated for both parameters. Many sponsors only power for the more variable one, but if the other parameter ends up outside the 80-125% range, the study fails. Joint power calculations ensure both endpoints meet criteria. Studies that ignore this have a 5-10% higher risk of failure.
Haley Gumm
February 24, 2026 AT 08:58
Just ran a BE study last month with a drug that had a 28% CV-turns out the literature said 17%. We were down to 24 subjects after dropouts. Total nightmare. Thank god we caught it before submission. Always run a pilot. Always. No exceptions. This post nailed it.
Gwen Vincent
February 26, 2026 AT 07:09
I appreciate how clearly this breaks down the real-world stakes. I’ve seen teams cut corners because they were “sure” the CV would be low. Then they get an FDA rejection letter that reads like a textbook case. It’s not just about stats-it’s about patient safety and company survival. Power isn’t optional. It’s the foundation.
Alfred Noble
February 26, 2026 AT 19:39
RSABE is a lifesaver for high-variability drugs. We used it for a cyclosporine generic last year-sample size dropped from 92 to 38. Game changer. Just make sure your software supports it (FARTSSIE does) and your team knows how to justify it. FDA reviewers eat that stuff up. Also, always document your GMR assumptions. I once forgot to note we used 0.94 instead of 1.00. Took 3 weeks to fix. :/
Lisandra Lautert
February 28, 2026 AT 12:18
22% of rejections due to power? That’s not a statistic. That’s a scandal.
Stephen Archbold
March 1, 2026 AT 03:59
Big nod to the checklist at the end. I printed that and taped it to my monitor. Seriously. We had a study fail because we only powered for AUC. Cmax blew past 125%. Rookie move. Now I check both. Always. Also, adding 15% for dropouts? Non-negotiable. People get sick. Move. Life happens. Plan for it.
kirti juneja
March 2, 2026 AT 04:25
Yo, this is the kind of post that makes me wanna hug a statistician. 🤗
Got my first BE project last year-thought I was being smart using lit CVs. Nope. Turned into a 6-month dumpster fire. Now I do pilot studies like my job depends on it. Because it does. Also, FARTSSIE is free? Bless. I’m gonna download it after this comment.
Spenser Bickett
March 3, 2026 AT 13:06
Ohhh so THAT’S why we’re paying $2M for 48 people to swallow pills for 3 weeks? I thought it was just corporate greed. Turns out it’s because some guy read a 2010 paper and assumed his drug was ‘like metformin.’
Classic. Let’s just make the FDA approve everything with a handshake and a prayer.
Christopher Wiedenhaupt
March 4, 2026 AT 05:13
Thank you for the comprehensive overview. The emphasis on documentation is particularly critical. Regulatory agencies are not merely evaluating statistical outcomes-they are auditing the entire decision-making chain. Incomplete traceability of CV% sources or failure to report software versioning can lead to rejection, even if the underlying analysis is sound. A meticulous approach is not just advisable-it is a regulatory imperative.