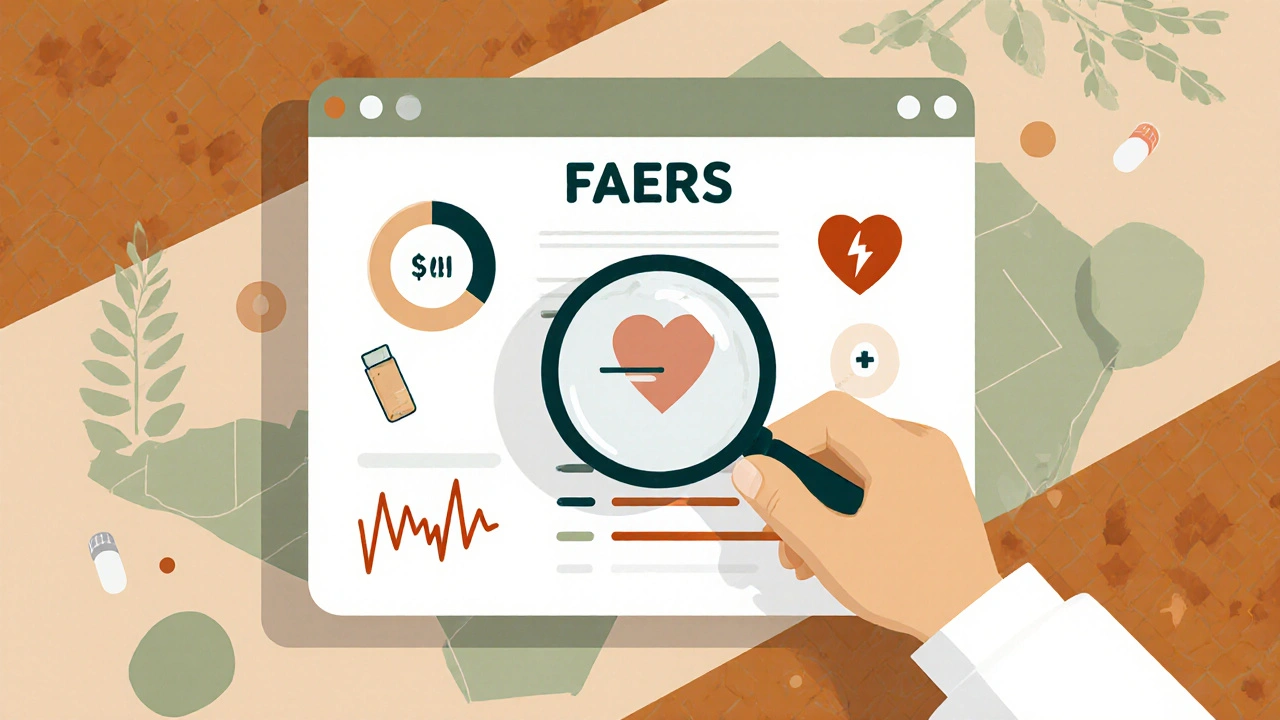
The U.S. Food and Drug Administration (FDA) keeps one of the largest public databases of drug safety reports in the world. It’s called FAERS - the FDA Adverse Event Reporting System. If you’ve ever wondered how regulators spot hidden risks in medications after they’ve been approved, this is where the answers start. FAERS isn’t a secret system. It’s designed to be open. But that doesn’t mean it’s easy to use. Thousands of people - researchers, doctors, patients, and even journalists - try to pull data from it every year. Most get stuck. Not because the data isn’t there, but because they don’t know how to ask the right questions.
What FAERS Actually Contains
FAERS holds about 30 million reports of side effects, medication errors, and product issues tied to drugs and biologics sold in the U.S. Every year, roughly 2 million new reports are added. These come mostly from drug companies (75%) who are legally required to submit them, and from doctors, nurses, and patients (25%) who report through the MedWatch program.
Each report includes basic details: age, gender, and approximate date of birth for the patient; the name of the drug(s) involved; the adverse event described (like ‘liver failure’ or ‘seizure’); and the outcome - whether the person recovered, was hospitalized, or died. The events are coded using a standardized medical dictionary called MedDRA. That’s where things get tricky. ‘Nausea’ and ‘vomiting’ might be separate codes. ‘Heart attack’ could be listed under ‘myocardial infarction.’ Without knowing how MedDRA works, you’ll miss half the relevant reports.
And here’s the biggest caveat: FAERS doesn’t prove that a drug caused the reaction. It just records that someone took the drug and then had a problem. Maybe the person was already sick. Maybe they took another medication. Maybe the event was unrelated. FAERS is a signal detector - not a proof machine.
Three Ways to Access the Data
You don’t need special clearance or a research grant to get into FAERS. There are three main ways to access it, each suited for different users.
- FAERS Public Dashboard - This is the easiest entry point. Launched in 2023, it’s a web tool that lets you type in a drug name and see how many reports mention it, broken down by age, gender, and type of reaction. You can filter by year, compare two drugs side by side, and download charts. No coding needed. Perfect for patient advocates, journalists, or anyone doing quick checks.
- Quarterly Data Extracts - If you want raw data, the FDA releases it every three months in ASCII and XML files. These are huge - often 1 to 5 gigabytes. You’ll need software like Python, R, or Excel with advanced plugins to open them. This is what researchers and data scientists use. But you have to know how to clean messy data. About 30% of the reports have missing fields or inconsistent entries. One study found that nearly half the time, the ‘primary suspect drug’ wasn’t clearly labeled.
- OpenFDA API - This lets you pull FAERS data directly into apps or scripts. It returns results in JSON format, which is great for developers. You can build custom dashboards, automate alerts, or link FAERS data to electronic health records. But again, you need programming skills. The API doesn’t fix the data’s flaws - it just delivers them faster.
What You Can’t Do With FAERS
It’s easy to misunderstand what FAERS can and can’t do. Here’s what it absolutely cannot tell you:
- How common a side effect really is. Without knowing how many people took the drug, you can’t calculate a rate. If 10 people report a rash after taking Drug X, but 10 million people used it, that’s rare. If only 100 people took it? That’s a red flag.
- Who reported it. The system strips out names and addresses for privacy. You can’t track down who filed a report. That’s good for privacy - bad if you’re trying to follow up.
- Why it happened. FAERS doesn’t collect lab results, medical records, or dosing history in detail. It’s based on what the reporter remembers or writes down.
- Whether it’s a real signal. A spike in reports doesn’t mean the drug is dangerous. Maybe a new doctor started prescribing it. Maybe a viral post online told people to report every little side effect. FAERS amplifies noise as much as it reveals truth.
Dr. Robert Ball from the FDA puts it plainly: “Data mining finds patterns. Patterns aren’t proof.” That’s why the FDA doesn’t make regulatory decisions based on FAERS alone. It uses it to flag things that need deeper study - like clinical trials or real-world data from Medicare or private insurers.

Who Uses FAERS - And Why
FAERS isn’t just for regulators. Different groups use it in different ways:
- Academic researchers (55% of users) - They use it to find rare side effects missed in clinical trials. One team at Johns Hopkins used FAERS to spot a link between a common antidepressant and sudden drops in blood sugar in diabetics - a connection no one had noticed before. That finding led to a warning update.
- Pharmaceutical companies (30%) - They’re required to monitor FAERS as part of their safety obligations. Most use commercial tools like Oracle Argus or ArisGlobal that pull FAERS data in and combine it with their own internal reports. They don’t use the public dashboard - they have better tools.
- Patient advocacy groups (15%) - These groups use FAERS to empower patients. One group found that a popular arthritis drug had a higher-than-expected number of reports linking it to severe skin reactions. They pushed for a label change, and the FDA added a warning within a year.
The rise in FAERS use isn’t accidental. Since the 21st Century Cures Act passed in 2016, there’s been more pressure on the FDA to open up its data. Academic use has grown 35% every year since 2020. More journals now require researchers to cite FAERS data when studying drug safety.
How to Get Started - Without Getting Lost
If you’re new to FAERS, here’s a practical roadmap:
- Start with the Public Dashboard. Go to the FDA’s FAERS page. Type in a drug name. Look at the top five reactions. Do they make sense? Are they known side effects? If yes, you’re on solid ground.
- Learn MedDRA basics. Don’t try to memorize it. But understand that it’s hierarchical. For example, ‘headache’ is a preferred term under ‘nervous system disorders.’ If you search for ‘headache,’ you’ll miss reports coded as ‘cephalalgia’ - the MedDRA synonym. Use the dashboard’s auto-suggest feature to find the right term.
- Check the date range. A spike in reports might just mean more people are using the drug. Compare the same drug across multiple years. Is the rate going up, or just the volume?
- Look for patterns across drugs. If multiple drugs in the same class (like all statins) show the same rare reaction, it’s more likely a class effect than a one-off.
- Don’t trust the numbers alone. Always cross-check with other sources - clinical trial data, published studies, or even FDA safety communications. FAERS is a starting point, not the end.
For those ready to go deeper: download a quarterly data extract. Use a free tool like R or Python with libraries like pandas or dplyr. Clean the data first - remove rows with missing drug names or outcomes. Then group by drug and reaction. Look for combinations that appear more often than you’d expect. But remember: you’re looking for hypotheses, not conclusions.

What’s Changing in 2025
FAERS isn’t static. It’s evolving. As of January 2024, all drug companies must submit reports in the new ICH E2B(R3) format. That means more structured data - better drug names, clearer timelines, more precise adverse event codes. It’s a big upgrade.
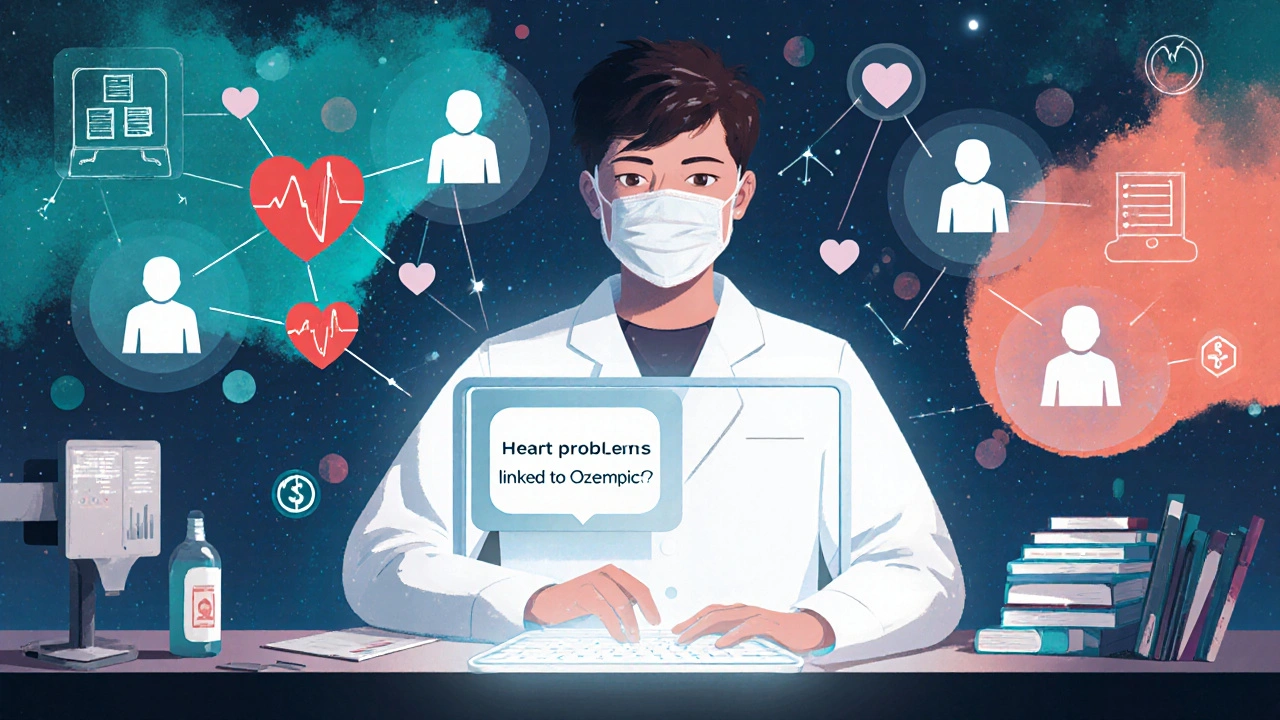
By late 2024, the FDA plans to launch a new API that lets you query the Public Dashboard’s analytics directly - no more downloading huge files. And by Q3 2025, they’ll add natural language processing to the dashboard. That means you’ll be able to type, “What are the heart problems linked to Ozempic?” and get accurate results - not just keyword matches.
The biggest change coming? Integration with real-world data. The FDA’s Sentinel Initiative is already linking FAERS reports with insurance claims and electronic health records. That will finally let them calculate true incidence rates - not just counts. This could turn FAERS from a signal detector into a real-time safety monitor.
Final Reality Check
FAERS is powerful. But it’s not magic. It’s messy. It’s incomplete. It’s full of noise. But it’s also the most transparent pharmacovigilance system in the world. No other country gives the public this much access.
If you’re a patient worried about a medication, use the dashboard to see what others have reported. If you’re a researcher, treat FAERS as a hypothesis generator - not a final answer. If you’re a journalist, dig deeper. Ask: Where did this spike come from? Is it real, or just louder reporting?
Transparency doesn’t mean simplicity. But with the right tools and a healthy dose of skepticism, FAERS can help you see what’s hidden in plain sight.
Is the FDA Adverse Event Database free to use?
Yes. All public access tools - including the FAERS Public Dashboard, quarterly data extracts, and the OpenFDA API - are completely free. No registration or payment is required. The only cost is your time to learn how to use them effectively.
Can I find out who reported an adverse event?
No. For privacy and legal reasons, the FDA removes all personally identifiable information (PII) from public data. This includes names, addresses, phone numbers, and medical record IDs. You can’t trace a report back to an individual, even if you’re a researcher or journalist.
Why do some drugs have way more reports than others?
More reports don’t always mean more danger. Popular drugs (like metformin or lisinopril) have millions of users, so naturally, more reports come in. Newer drugs get more attention from doctors and patients. And some drugs trigger more reporting because of media coverage or social media trends. Always compare reports to the number of people using the drug - which FAERS doesn’t provide.
How often is the data updated?
The FDA releases new data quarterly - in March, June, September, and December. The Public Dashboard updates within a few weeks after each release. Raw data files are posted on the FDA website within 30 days of each quarter’s end.
Can I use FAERS data for my research paper?
Yes. FAERS is one of the most commonly cited sources in pharmacovigilance research. Over 70% of U.S.-based drug safety studies use it. Just be clear about its limitations. Don’t claim causation. Don’t use raw counts as rates. Always mention that FAERS data are spontaneous reports and may be incomplete or biased.
What’s the difference between FAERS and EudraVigilance?
FAERS is the U.S. system and offers full public access to its dashboard and data extracts. EudraVigilance is the European system. While it holds more data from 30+ countries, the public can’t access individual case reports - only aggregated summaries. Researchers can apply for restricted access, but it’s harder and slower than using FAERS.

Josh Gonzales
November 25, 2025 AT 08:00
Just used the FAERS dashboard for the first time yesterday to check on my mom's blood pressure med. Surprised how easy it was to filter by age and outcome. Found 37 reports of dizziness in people over 70 - way higher than I expected. Still, as the post says, no way to know if it was the drug or just aging. Good starting point though.
Caroline Marchetta
November 25, 2025 AT 08:10
Oh wow. So we're supposed to trust a system where 75% of the data comes from *pharmaceutical companies* who are legally obligated to report but have a vested interest in downplaying harm? How quaint. The FDA's 'transparency' is just a PR stunt wrapped in MedDRA jargon. I'll believe it when I see them release internal audit logs of how many reports they 'sanitized' before publication.
Jacqueline Aslet
November 25, 2025 AT 13:59
One must acknowledge the epistemological limitations inherent in spontaneous reporting systems. The very structure of FAERS precludes causal inference, rendering it ontologically inadequate as a basis for public health policy without robust epidemiological triangulation. One cannot derive population-level risk from individual anecdotal narratives - this is not merely a methodological flaw, but a metaphysical one.
Jack Riley
November 27, 2025 AT 12:04
Everyone’s acting like FAERS is some sacred oracle, but let’s be real - half these reports are from people who think their hangover was caused by metformin. And don’t get me started on the 2022 spike in ‘anxiety’ reports after a TikTok trend. The FDA’s not hiding data - they’re drowning in noise. The real problem? We’ve turned pharmacovigilance into a spectator sport.
Valérie Siébert
November 28, 2025 AT 09:15
OMG I just tried the OpenFDA API and it was like magic!! I built a little script that pulls all reports for Ozempic and graphs the rash cases over time - it’s wild how it spiked after that influencer posted about it. I’m gonna turn it into a dashboard for my diabetes group!! We need more people doing this!!
Agastya Shukla
November 29, 2025 AT 21:20
For researchers outside the US, FAERS is still the most accessible system. EudraVigilance requires months of paperwork just to get a login. I used FAERS data in my paper on SGLT2 inhibitors and kidney events - the sample size was huge. Just remember to adjust for prescribing trends and always cite the limitations. The data isn’t perfect but it’s the best we’ve got.
Aki Jones
November 30, 2025 AT 02:33
...and yet... no one talks about the fact that the FDA has been quietly removing reports since 2021... I have a friend who works in their data division... she says they auto-delete anything flagged as 'low severity' or 'non-serious'... and the dashboard doesn't show the deleted ones... you think this is transparency? This is censorship with a user-friendly interface...
katia dagenais
November 30, 2025 AT 09:22
You all are missing the point. FAERS isn’t broken - it’s being weaponized. The system was designed to detect *signals*, not to be used by laypeople to scare themselves into quitting meds. Look at what happened with Paxil - people saw a few reports of suicidal ideation, started panicking, stopped cold turkey, and then had withdrawal seizures. The real harm isn’t the drug - it’s the misinformation loop FAERS feeds. We need filters. We need warnings. We need adults in the room.
Arup Kuri
December 1, 2025 AT 02:03
lol why are you all so serious about this database. I looked up Adderall and saw 5000 reports of 'insomnia' - DUH. It's an amphetamine. The real question is why the FDA lets pharma companies sell this stuff to 12-year-olds in the first place. This whole system is just a distraction from the real problem - profit over people.
Dolapo Eniola
December 2, 2025 AT 12:43
USA thinks it owns safety data but Nigeria has 10x more adverse events and no one cares! We don’t even have a FAERS equivalent! You people complain about messy data? Try getting a doctor to fill a form when the clinic has no internet! FAERS is luxury privilege. Your ‘transparency’ is just colonialism with JSON.